Victoria’s Climate Science Report 2024
Victoria’s Climate Science Report 2024 (VCSR24) summarises the best available scientific evidence on the climate for our state. The report builds on the earlier Victoria's Climate Science Report 2019 (VCSR19), which remains a relevant component of our scientific evidence base.
 VCSR24 and supporting regional summaries and resources can be used by Victorian decision-makers across businesses, the community and government, to improve research, risk assessments and planning for climate resilience.
VCSR24 delivers important messages about Victoria’s changing and future climate:
- Victoria’s climate has continued to warm since the 19th century, becoming drier in recent decades and experiencing more frequent and intense climate hazards.
- Victoria will experience a warmer future climate with further increases to average temperatures and more frequent and intense hot days.
- Victoria is likely to continue to become drier, especially in winter and throughout the cool season (April – October), while the intensity of short duration extreme rainfall events is projected to increase.
- High-impact climate hazards that affect Victoria, including floods, heatwaves, drought, bushfires and sea-level rise, are also changing and are projected to exacerbate under a warming climate.
VCSR24 highlights that we can minimise the impacts of climate change if global emissions achieve a low emissions scenario. This shows that it is not too late to act, and that further action to reduce greenhouse gas emissions is crucial to reducing the impacts of climate change. For information on how we are reducing emissions as well as adapting to Victoria's changing climate, see Victoria’s Climate Change Strategy and Our commitment to adapt to climate change.
The figure below summarises projected changes for Victoria’s climate under two global greenhouse gas emissions scenarios (low and high).
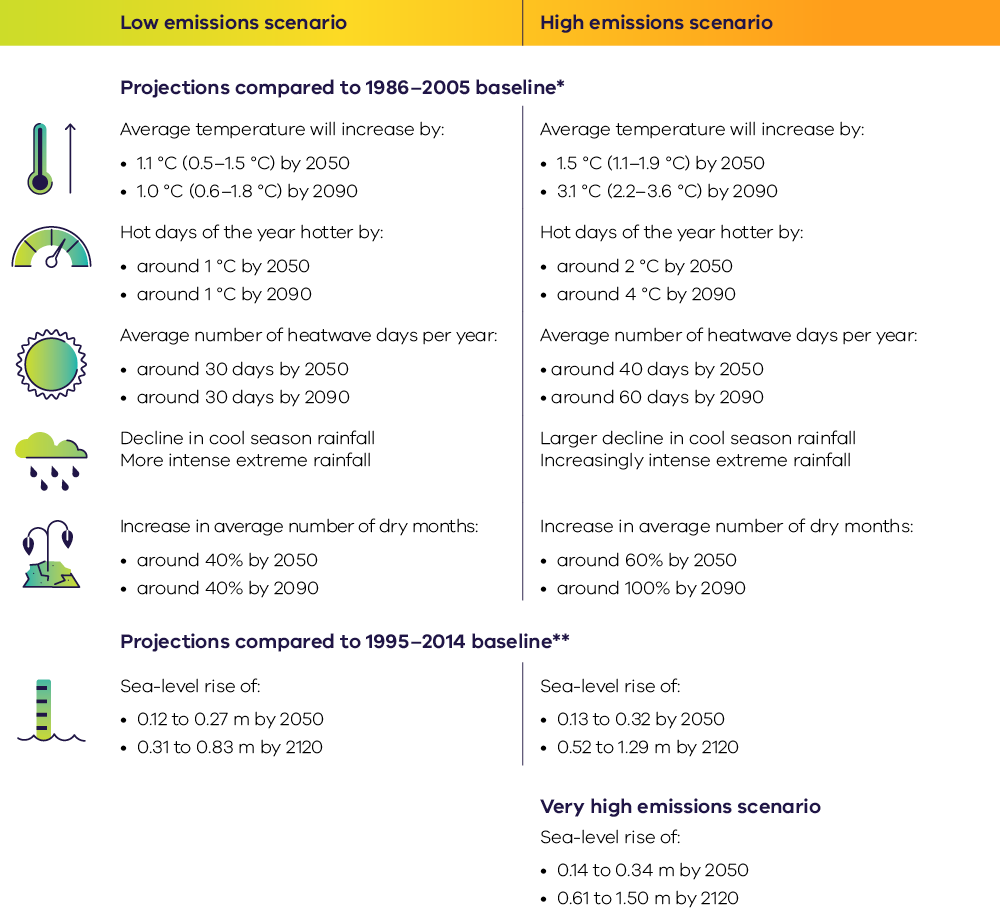
** CMIP6 projections, based on low (SSP1-2.6), high (SSP3-7.0) and very high (SSP5-8.5) emissions scenarios. Sea level is lowest and highest as taken from the Melbourne, Warrnambool or Gabo Island locations from projected changes (17–83% uncertainty range). Very high emissions scenario provided as additional CMIP6 sea-level rise projections study available for Victoria.
Source: VCSR24, p. 7
Victoria’s climate is already changing
Evidence that Earth’s climate is changing has strengthened since the publication of VCSR19.
Global atmospheric and ocean temperatures are increasing, sea levels are rising, extreme weather events are becoming more frequent and intense, and the global water cycle is changing. These changes have predominantly occurred in response to increasing atmospheric concentrations of greenhouse gases, primarily caused by human activities.
Victoria’s climate has warmed since the 19th century, becoming drier in recent decades and experiencing more frequent and intense climate hazards.
The figure below summarises some observed changes in Victoria’s climate to 2024.
Victoria's climate has already changed - observed as of 2024
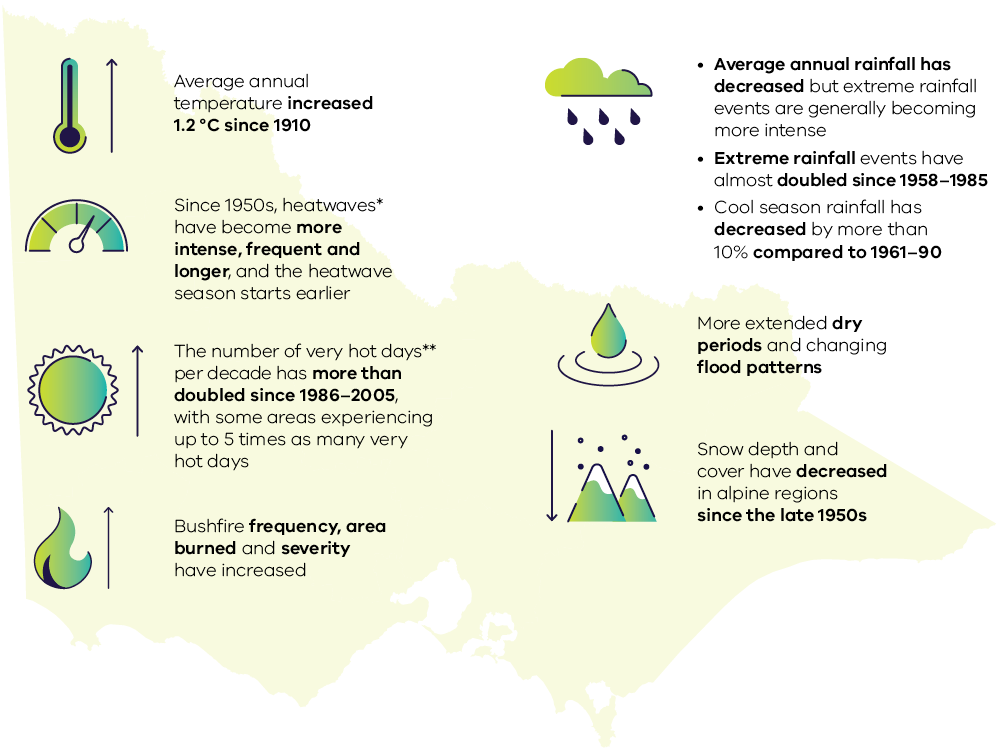
** Very hot days are defined as days with daily maximum temperature exceeding the 99.9th percentile.
Source: VCSR24, p. 5
Victoria’s climate is shaped by large-scale climate drivers, weather systems and seasonal influences. As concentrations of greenhouse gases continue to increase in the atmosphere, further shifts in the scale and timing of climate drivers and weather systems are likely to occur, with flow-on effects for Victoria’s climate.
Observations of Victoria’s climate show it continues to change, with increasing temperatures, hotter extremes and changing rainfall patterns.
Chapter 1 of VCSR24 provides more information on the Earth’s changing climate and greenhouse gas emissions.
Victoria has experienced an overall warming of 1.4 °C since the pre-industrial baseline period of 1850-1900, and 1.2 °C since 1910.
The figures below shows the observed annual average temperature over Victoria from 1910 to 2023.
Observed increases in Victoria's annual mean temperature
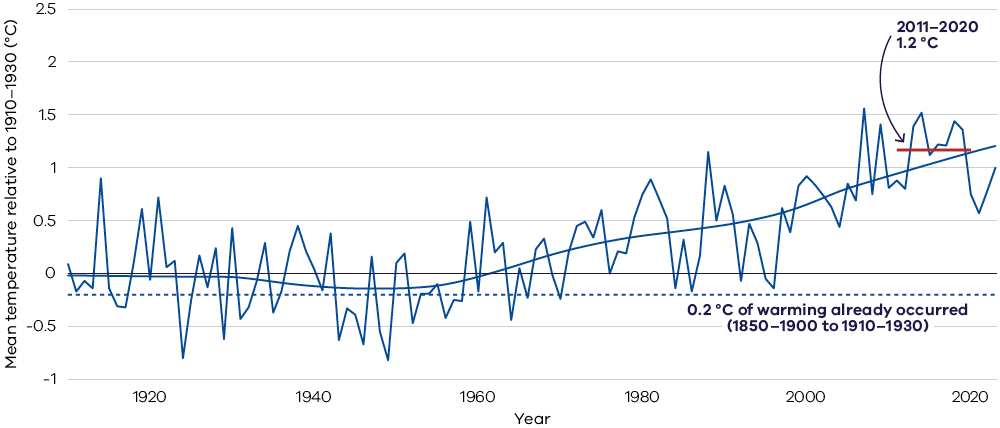
Source: VCSR24 p.22, Figure 7(a)
Climate Stripes 1910–2022: Annual average temperature anomalies across Victoria (relative to 1961–1990)
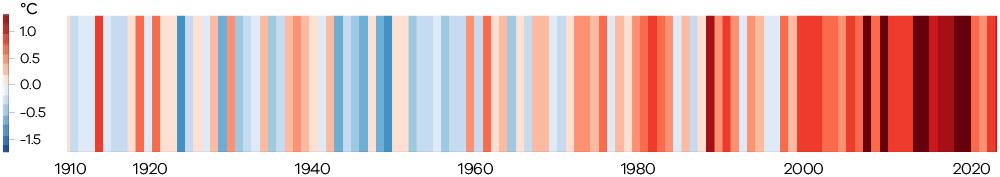
Source: VCSR24 p.22, Figure 7(b). Adapted from CSIRO, 2024.
The number of hot days and very hot days continues to increase across Victoria, especially inland. The more extreme hot days have experienced the largest increases, especially over the past decade.
The figure below shows recent changes in the average number of hot days and very hot days.
Observed increase in hot and very hot days
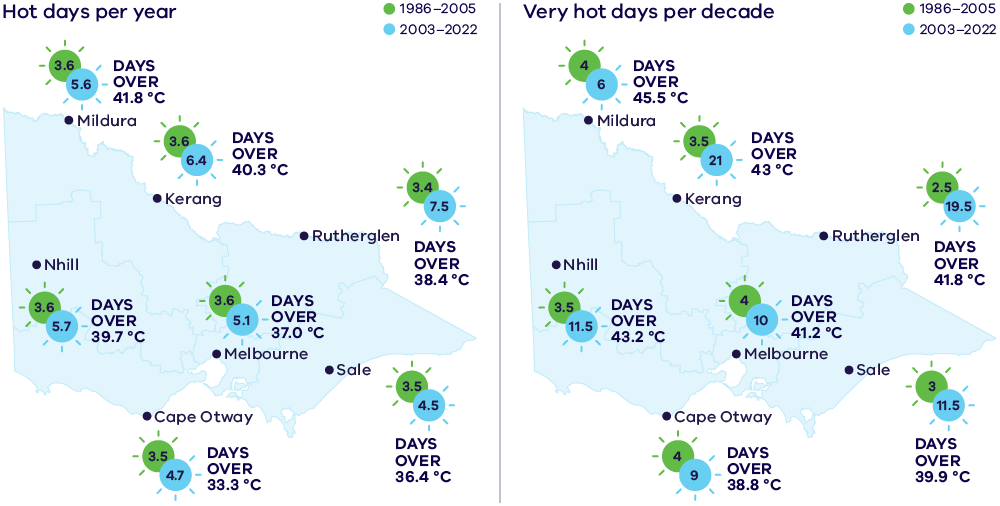
Source: VCRS24, p.24, Figure 8. Adapted from CSIRO, 2024.
Chapter 2 of VCSR24 provides more information on Victoria’s changing climate.
The research shows that Victoria’s observed rainfall trends have been at least partly driven by human-caused climate change. These trends include:
- Victoria’s average rainfall has decreased over the past half-century in all seasons except summer. Over the last 30 years, Victoria’s cool season (April–October) rainfall has declined by more than 10% compared to the 1961–90 period. Extreme rainfall events are generally becoming more intense.
- These rainfall changes have not been constant across the state, with larger declines experienced in the alpine region than elsewhere.
Snow depth and cover have decreased in Victorian alpine regions since the late 1950s, and the frequency of frost-risk days has generally decreased in recent decades.
The figure below shows observed decline in cool season rainfall over Victoria from 1910 to 2023.
Observed declines in Victoria’s cool season rainfall
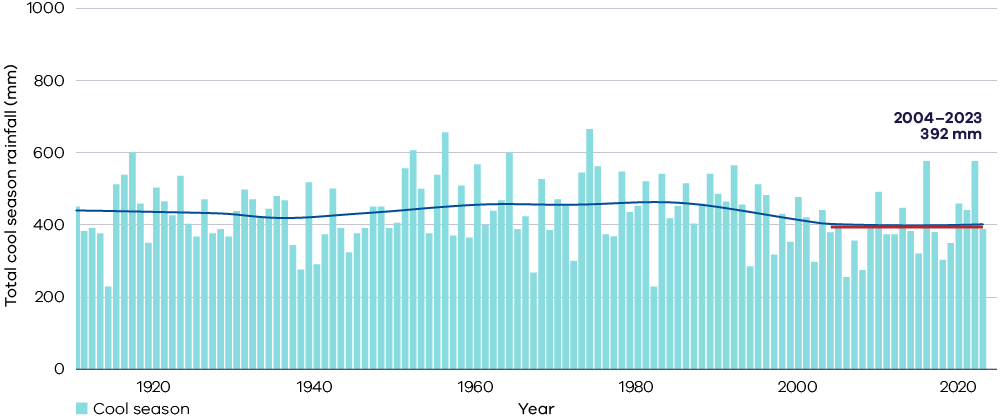
Source: VCSR24, p25, Figure 9. Adapted from CSIRO, 2024.
Chapter 2 of VCSR24 provides more information on Victoria’s changing climate.
Updated climate projections for Victoria
While Victoria's future climate will depend on the global greenhouse gas emissions scenarios, Victoria will:
- experience a warmer future climate with further increases to average temperatures and more frequent and intense hot days.
- likely continue to become drier, especially in winter and throughout the cool season (April – October), while the intensity of short duration extreme rainfall events is projected to increase.
VCSR24 includes climate projections based on the latest generation of global climate models, from the sixth phase of the World Climate Research Programme’s Coupled Model Intercomparison Project (CMIP6). VCSR24 projections are presented for two-time horizons: 2050 and 2090.
Under the internationally recognised new framework for emissions scenarios, ‘Shared Socio-economic Pathways’ (SSPs), two emission scenarios are applied, the:
- low emissions scenario (SSP1-2.6) and
- high emissions scenario (SSP3-7.0).
For climate hazards, other emissions scenarios and climate modelling studies have been analysed where relevant and available. The mean sea-level rise projections go to 2120 and include additional emissions scenarios.
VCSR24 projections add to – rather than replace – Victoria’s existing suite of projections developed for VCSR19. In keeping with the best climate science practically available at the time, VCSR19 projections used the fifth generation of global climate models (CMIP5).
VCSR19 includes ‘medium’ and ‘very high’ emissions scenarios – noting the latter was referred to as ‘high’ under CMIP5. These projections remain a relevant component of our evidence base. In keeping with CMIP5, VCSR19 projections used the ‘Representative Concentration Pathways’ (RCPs) framework for emissions scenarios.
For more information see:
- Factsheet 1 - How do the Victorian Climate Projections 2024 compare with previous climate projections for Victoria (PDF, 319.3 KB)
- Factsheet 1 - How do the Victorian Climate Projections 2024 compare with previous climate projections for Victoria - accessible (DOCX, 1.0 MB)
The figure below summarises greenhouse gas emissions frameworks and can be used to compare SSPs used in VCSR24, to RCPs used in VCSR19.
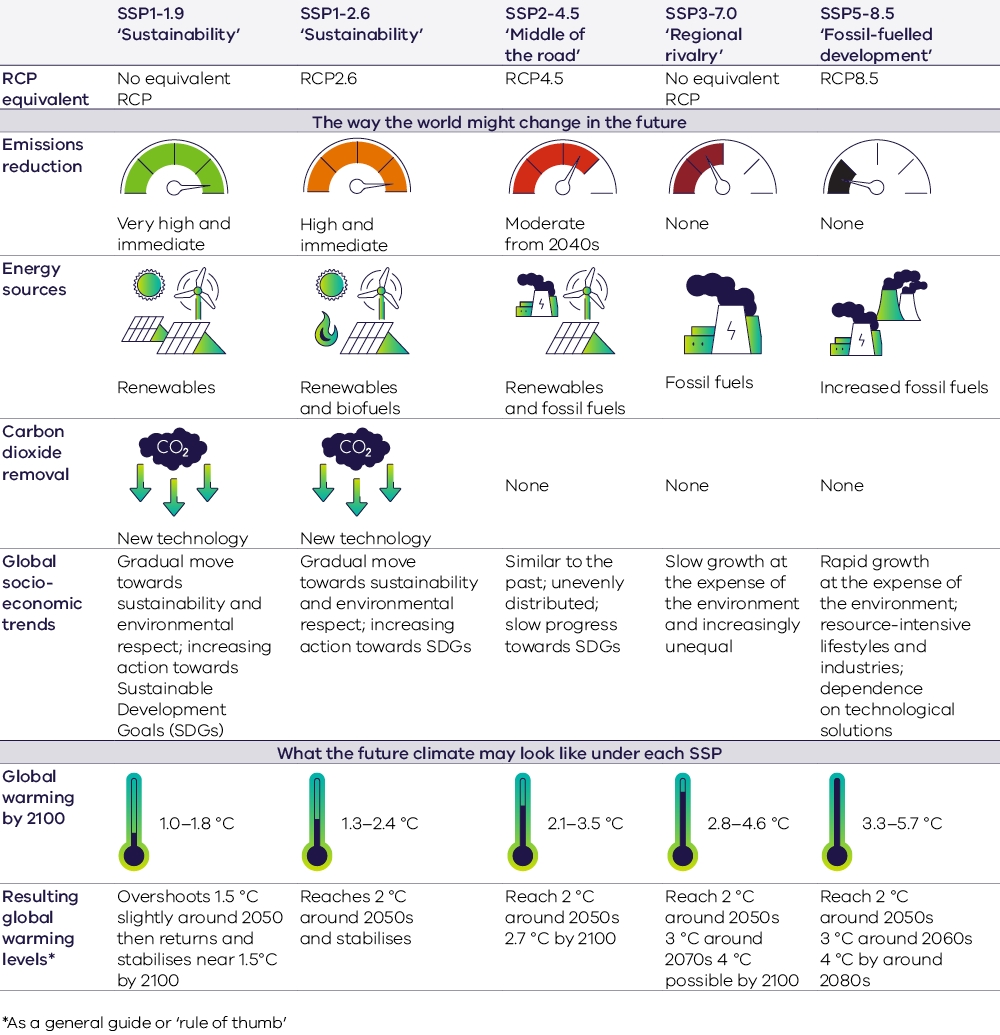
Source: VCSR24, p31, Figure 12. Adapted from National Environmental Science Program’s Climate Systems Hub, 2024, under CC BY 4.0.
Victoria is projected to experience a warmer future climate with increasing average temperatures, more frequent and intense hot days, and longer and more frequent heatwaves.
The graph below shows observed and projected future annual average temperatures for Victoria under two greenhouse gas emissions scenarios. It also shows the close alignment of historical modelling with observed temperature.
A warmer Victoria by 2100
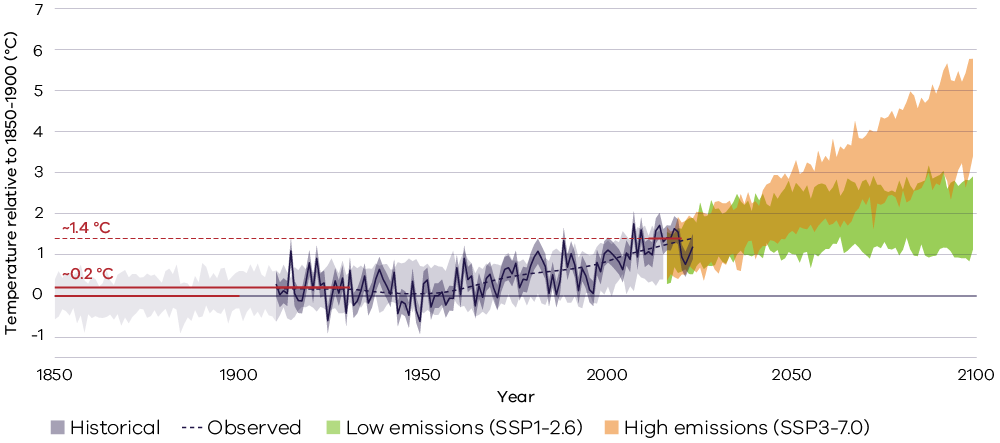
Source: VCSR24, p.34, Figure 14.
Compared to a baseline climate for the period between 1986-2005, Victoria is expected to experience average warming of 1.5 °C by 2050 and 3.1 °C by 2090 under a high emissions scenario. Under a low emissions scenario Victoria is expected to warm by 1.1 °C by 2050, with little subsequent warming.
A warming climate also means that hot days will become hotter and more frequent. The number of hot days is expected to increase under all emissions scenarios and time horizons.
The figure below shows projected hot days across Victoria for 2050 and 2090 under a high greenhouse gas emissions scenario.
Projected hot days per year
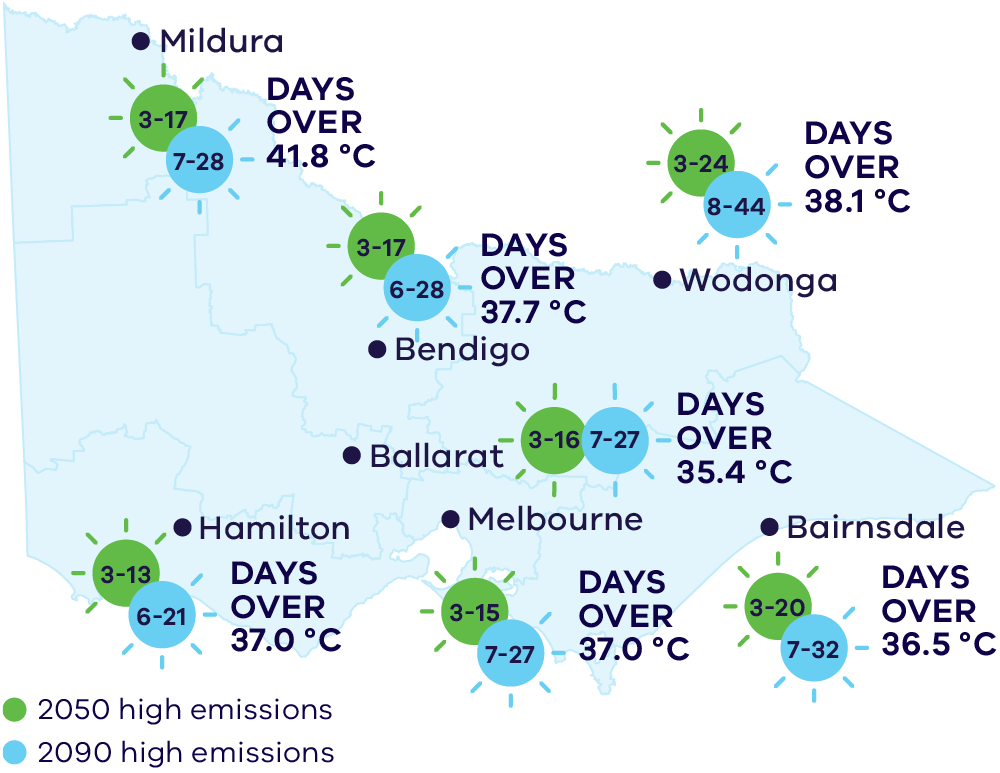
Source: VCSR24, p.36, Figure 16. Adapted from CSIRO, 2024.
Chapter 3 of VCSR24 provides more information on the updated climate projections for Victoria.
Victoria is likely to continue to become drier on average, especially in winter and throughout the cool season. This long-term drying trend will be overlaid by large natural year-to-year and decade-to-decade variability, and cooler and wetter periods will still occur in the future.
Dry periods are projected to be drier and hotter, while extreme rainfall events are projected to become more intense. Extreme rainfall is one of the main drivers of flood events.
Understanding and projecting regional rainfall changes over Victoria remains an ongoing scientific challenge. Despite this there is medium to high confidence that Victoria is expected to continue to become drier during the cool season (April to October), especially under the high emissions scenario.
The graph below shows projected change (%) in seasonal rainfall for 2050 for low and high emissions scenarios.
Projected changes in Victorian mean seasonal rainfall for 2050
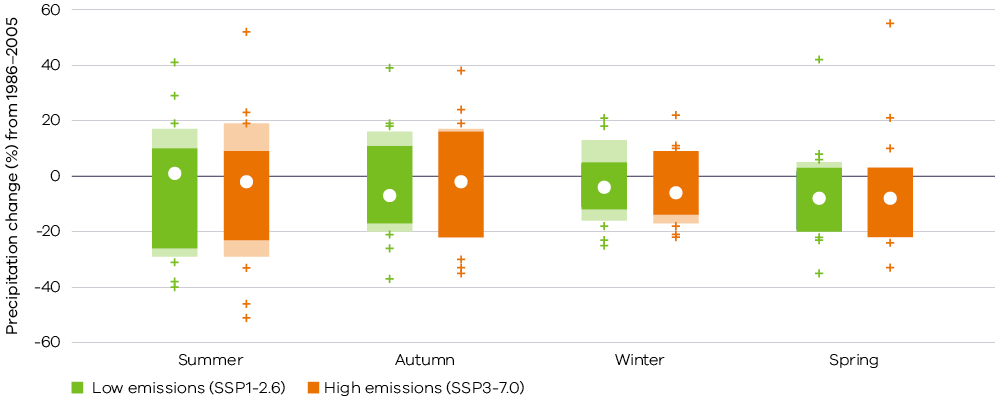
Source: VCSR24, p.38, Figure 18.
The darker-coloured segments of each bar represent the 10th to 90th percentile range of projections from all global climate models, while the lighter ‘extension’ segments of each bar represent the 10th to 90th percentile range projected by the regional climate models.
Chapter 3 of VCSR24 provides more information on the updated climate projections for Victoria.
Understanding climate hazards in Victoria
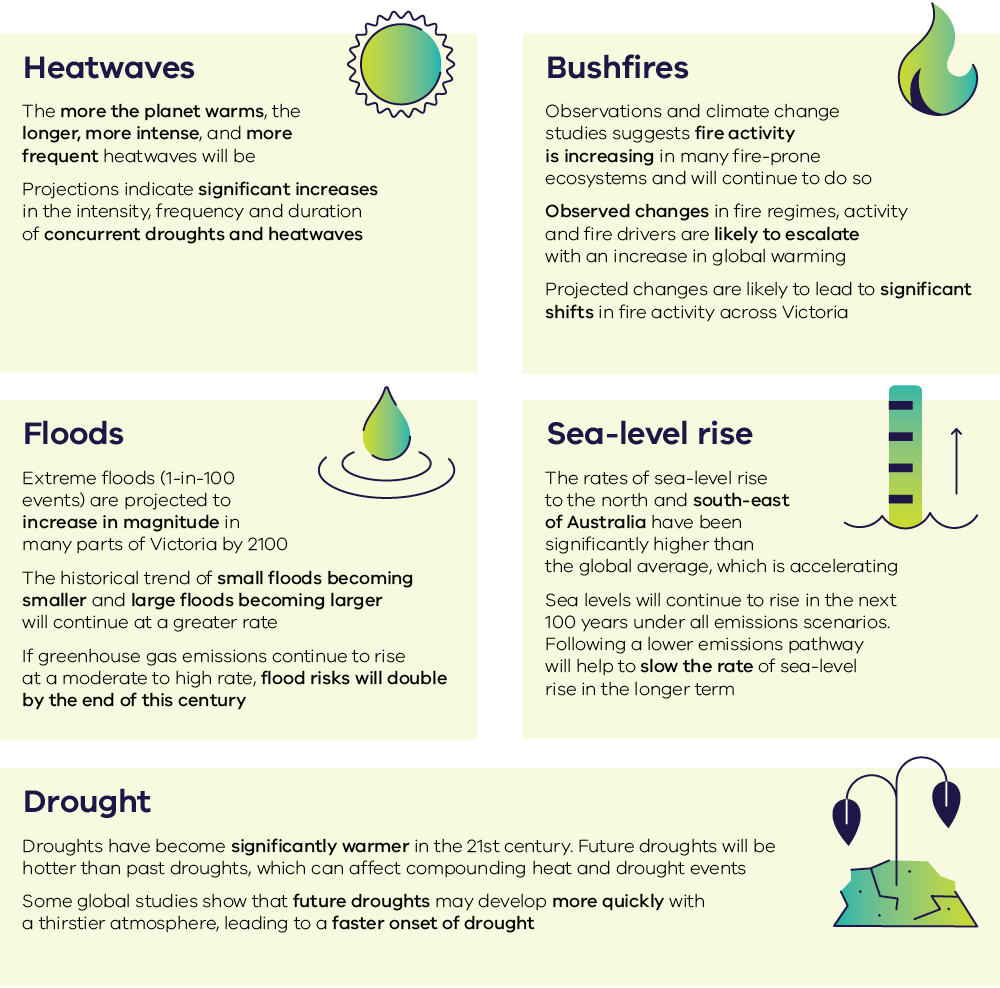
Climate hazards that affect Victoria, including floods, heatwaves, drought, bushfires and sea-level rise, are changing under a warming climate and are projected to exacerbate under a warming climate.
The figure below shows observed and projected changes in climate hazards affecting Victoria.
Climate hazards in Victoria are changing under a warming climate
Floods are a natural part of Victoria’s environment. While they are generally a result of intense rainfall, their behaviour and magnitude are influenced by a range of factors.
- Over the past 70 years, Victoria has experienced:
- extreme flood events at different locations at least 10 times
- an increase of approximately 3% per decade in the magnitude of large floods due to increasing rainfall intensities
- a decrease of between 5% and 13% per decade in the magnitude of smaller floods.
- Smaller and more frequent floods that contribute to the health of our floodplain and riverine environment have been decreasing in magnitude, despite increases in extreme rainfall.
- The historical trend of small floods becoming smaller and large floods becoming larger is projected to continue at a greater rate in future, depending on the emissions pathway followed.
- If greenhouse gas emissions continue to rise at a medium to high rate, flood risk in Victoria is likely to double by the end of the century. That is, a flood with a historical 1-in-100 chance of being exceeded now may occur twice as often by 2100.
- The precise rate at which floods will increase is subject to uncertainty.
The maps below show projected changes in the magnitude of small and large floods in Victoria by 2100 compared with historical conditions, for medium and very high emissions scenarios.
Projected change in the magnitude of floods in Victoria by 2100
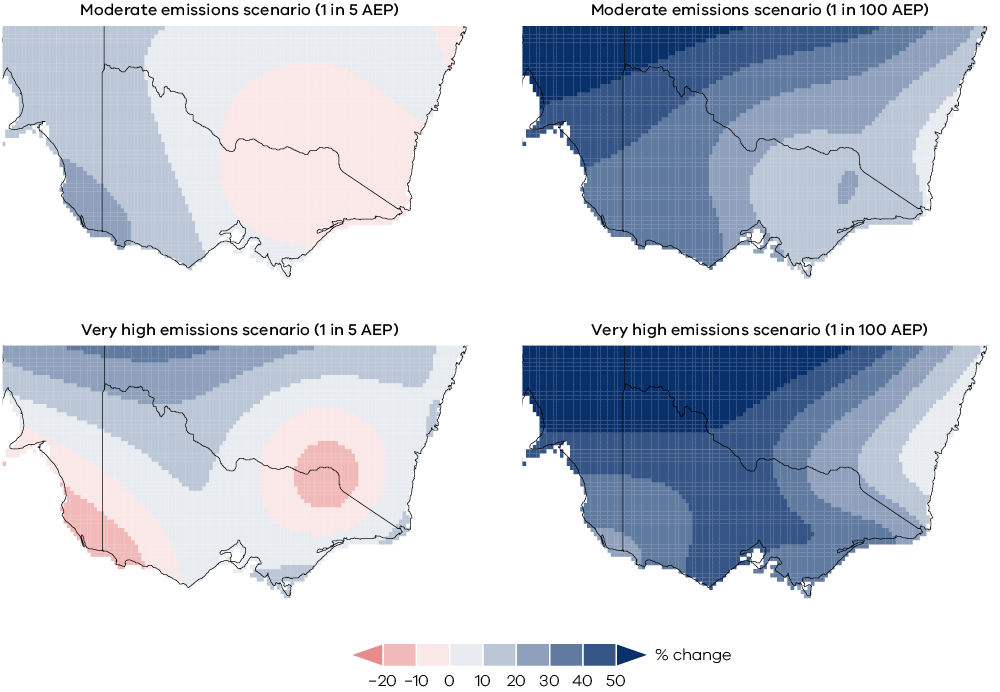
Source: VCSR24, p.52, Figure 26. Credit: Rory Nathan and Conrad Wasko for VCSR24.
Chapter 4 of VCSR24 provides more information on flood hazards in Victoria.
Heatwaves are prolonged periods of excessive heat that generally last for at least 3 or more successive days.
Since the 1950s:
- the intensity, frequency and duration of heatwaves in Victoria have increased, and the typical Victorian heatwave season is now longer and starts earlier
- observed heatwave trends have increased at a faster rate over the past few decades.
Future changes in Victorian heatwaves will be driven by increasing global temperatures. More warming will result in longer, more intense and more frequent heatwaves.
There is some evidence that expansion of Melbourne’s urban areas could result in higher night-time temperatures during heatwave events due to excess heat accumulated during the day.
The new high-resolution downscaled projections indicate that the frequency of heatwave days in Victoria is likely to increase from the historical average of 20 days a year (1986–2005). By 2090, under a high emissions scenario, the frequency of heatwave days could more than triple. Victoria could experience around 60 heatwave days rather than the 20 experienced historically.
The graph below shows projected increasing frequency of annual heatwave days per year for 2040-2059 and 2080-2099 compared to 1986-2005, under low and high emissions scenarios.
Increases in frequency of heatwave days based on indicative projections
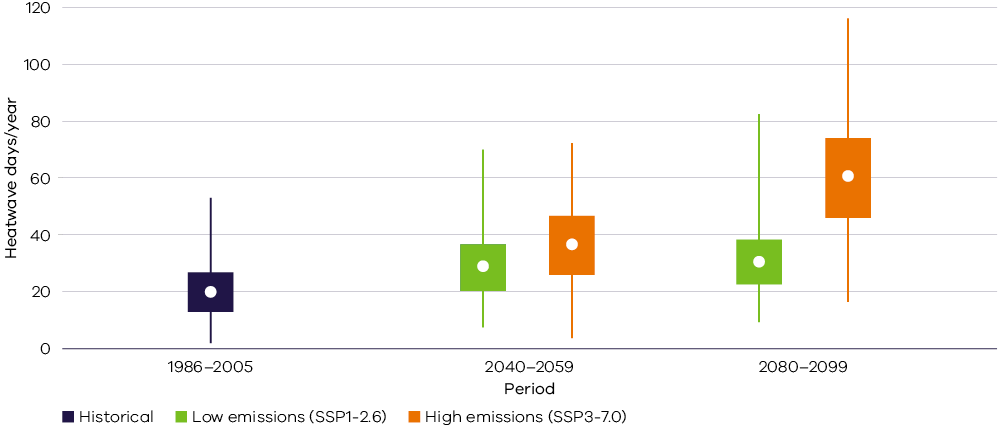
Source: VCSR24, p.59 , Figure 30. From CSIRO, 2024.
Chapter 4 of VCSR24 provides more information on heatwave and extreme heat hazards in Victoria.
Drought is a pervasive part of the Victorian landscape.
- Droughts have become significantly warmer in the 21st century due to human-caused climate change.
- A few studies report increases in drought duration and intensity in south-east Australia.
- Droughts in Victoria are likely to continue to increase under a warming climate, although the precise nature and extent of the impacts are unclear.
- Future droughts will be hotter than past droughts, which can affect compounding heat and drought events.
- Future droughts may develop quicker under a thirstier atmosphere.
- Some evidence suggests changes to drought characteristics may follow shifts in rainfall distributions.
- New high-resolution downscaled projections indicate that there may be an increase in the occurrence of dry months in Victoria in future, with almost a doubling of dry months projected by 2090 under the high emissions scenario relative to 24 dry months experienced during the 1986–2005 period.
Chapter 4 of VCSR24 provides more information on drought hazards in Victoria.
Fire is ancient, complex and inextricably linked to human activities across Australia.
- There is strong and robust evidence that climate change affects fire weather.
- Observations suggest fire activity is increasing in many fire-prone ecosystems and will continue to do so.
- A range of changes in fire regimes, activity and drivers in Victoria have already been observed, including a longer fire season, with more frequent days of significant fire danger.
- These changes are likely to escalate with increasing global temperatures.
- Low fuel moisture plays an important role in fire ignitions in Victoria, with potential increased ignition risk projected under warmer and drier future climates.
- Changes in fire risk will not be the same everywhere and will depend strongly on local fire conditions.
- Fire weather and fire activity are projected to increase in many regions of south-east Australia.
- Most of the evidence on changes to Victoria’s fire activity focuses on forest and woodland environments, but important changes could also take place in grassland and semi-arid areas.
The table below shows observed and projected changes, and the confidence in the increase or decrease, of fire activity and fire drivers.
Confidence in observed and projected changes related to fire activity and drivers
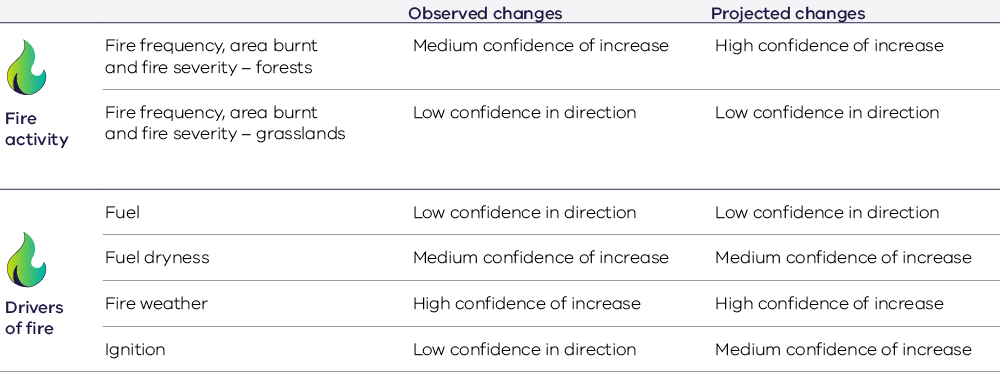
Source: VCSR24, p. 76, Figure 41. Credit: Hamish Clarke, Victoria Reynolds and Tom Fairman for VCSR24.
Chapter 4 of VCSR24 provides more information on fire hazards in Victoria.
Sea-level rise is driven by oceanic and atmospheric influences and more specific mechanisms such as thermal expansion, ocean currents, melting glaciers and ice sheets, and vertical land movement.
- Sea-level trends assessed between 1901 and 2018 indicate that globally, the average rate of sea-level rise is accelerating.
- Since 1993, the rates of sea-level rise to the north and south-east of Australia have been significantly higher than the global average, whereas rates of sea-level rise along the other coasts of the continent, including Victoria, have been closer to the global average.
- Sea levels will continue to rise in the next 100 years under all emissions scenarios. However, following a lower emissions pathway will help to slow the rate of sea-level rise but will not stop or reverse the rising trend.
The images below show projected sea-level rise for 2050 and 2120 across three locations in Victoria compared to 1995-2014 for low, high and very high emissions scenarios.
Sea-level rise projections for Victoria
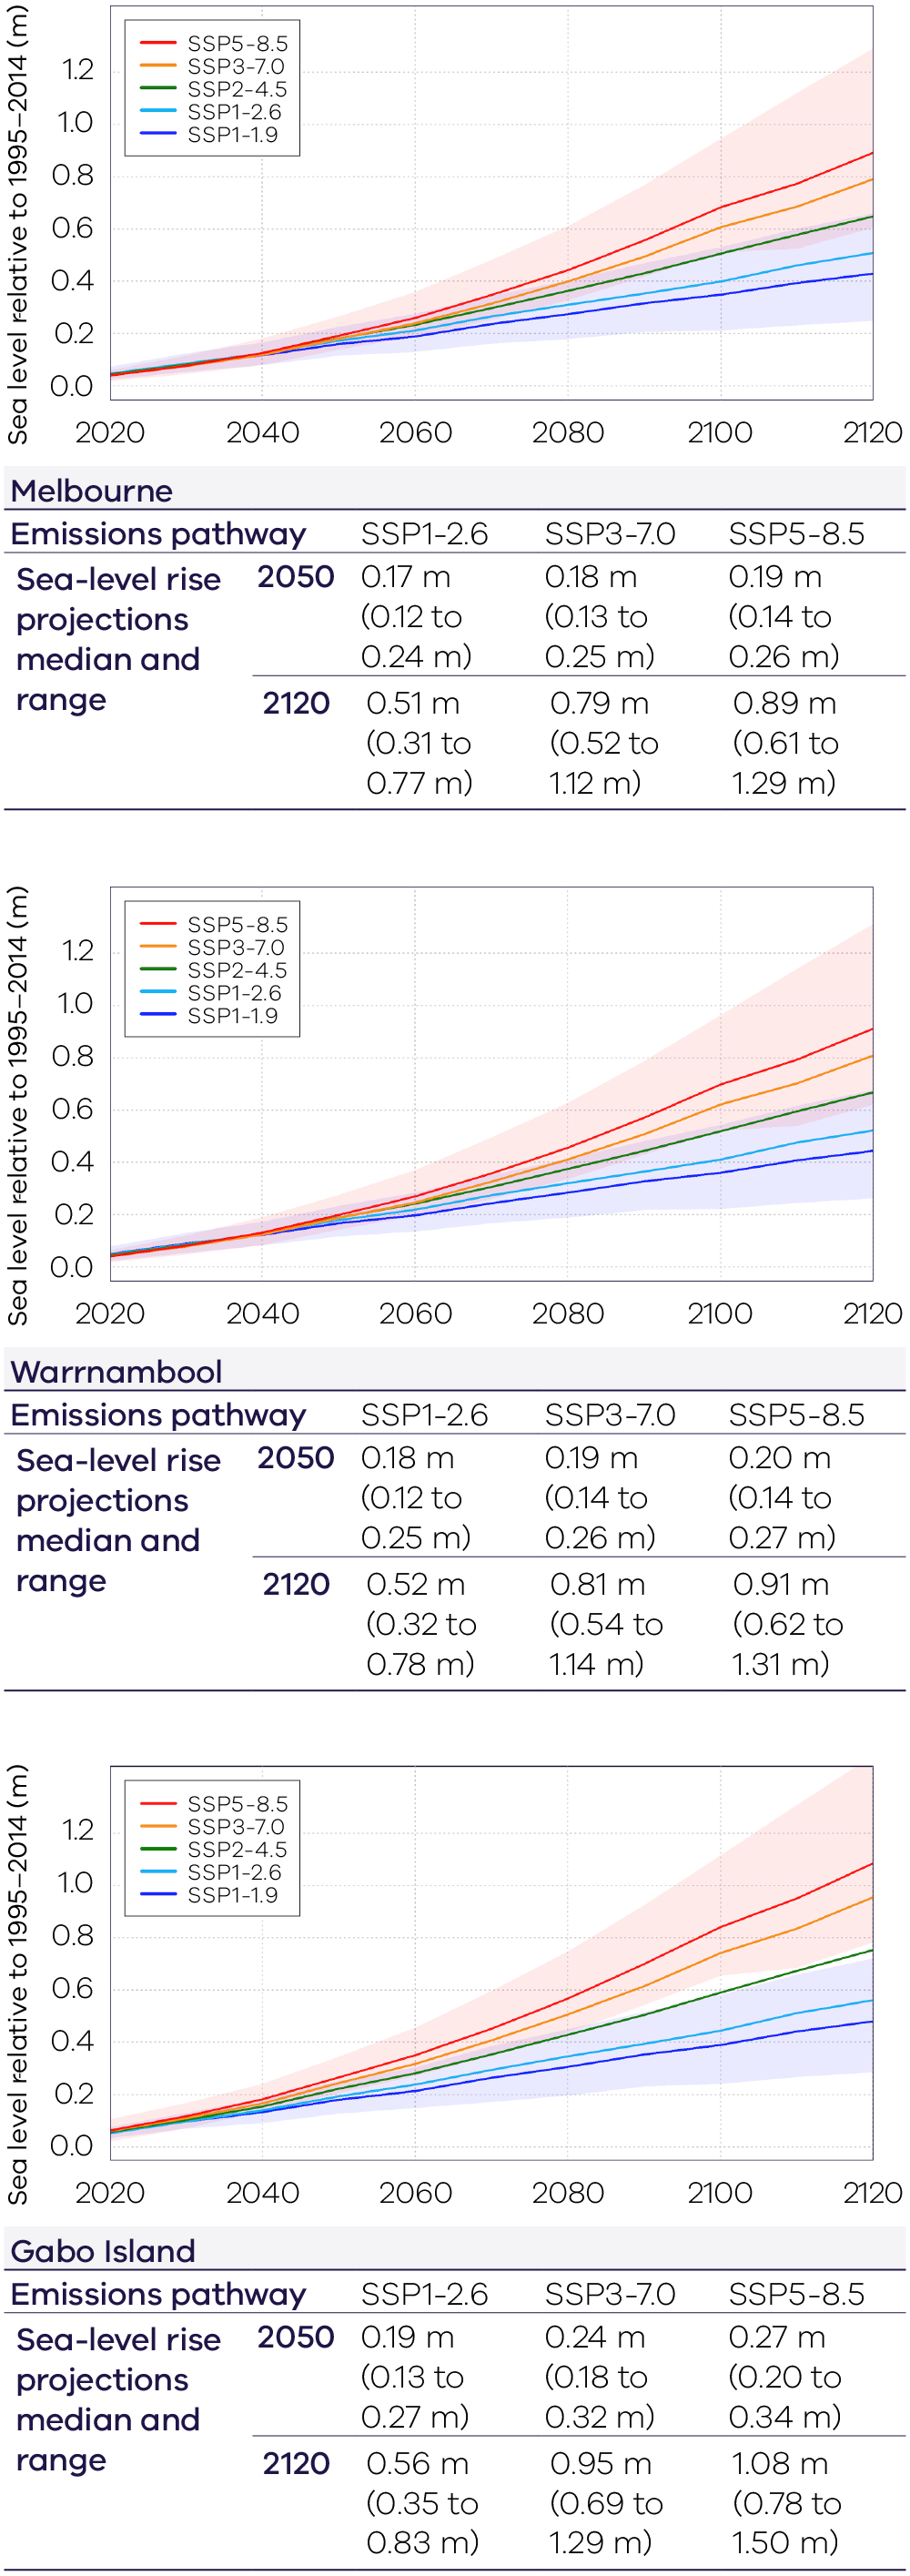
The projections are expressed as a median and 17-83% confidence range (in brackets), relative to the baseline period of 1995–2014.
Source: VCSR24, p. 85, Figure 46. Credit: McInnes & Zhang, 2024.
Chapter 4 of VCSR24 provides more information on climate change impacts on hazards in Victoria.
Applying climate science in decision making
Decision makers can draw on different types of climate information depending on their needs.
Observational data can be used to minimise current exposure to climate change, while climate projections can inform medium – and long-term adaptation strategies.
Information on extreme weather events supports the capacity of organisations and communities to cope with severe weather events.
Climate projections are useful tools to gauge the scope and scale of likely future climate change and to illustrate the difference between emissions scenarios. While there are a range of projections indicating that Victoria’s climate will change, it is not possible to determine the exact impacts of climate change at any location or time with certainty.
While climate projections are a valuable resource for planning for a changing climate, they can be difficult to use in practice and can never be perfect quantitative measures of the full set of possibilities far into the future.
Chapter 5 of VCSR24 provides more information on applying climate science in decision making. Also see:
- Factsheet 3 - Using the Victorian Climate Projections 2024 (PDF, 295.6 KB)
- Factsheet 3 - Using the Victorian Climate Projections 2024 - accessible (DOCX, 999.1 KB)
Case studies
Our case studies can help you understand how climate science and our resources can be applied to your work:
Used climate science to inform risk assessments and ensure that their buildings and spaces will comfortably adapt to increasing climate variability.
Used climate science to inform a long-term vision for its campus and continue to deliver its core objectives under a changing climate.
Used climate science to inform risk prioritisation for DEECA’s physical assets and operations. The case study also outlines reasoning for selecting emissions scenarios and time horizons.
Victoria’s Future Climate Tool
Victoria's Future Climate Tool can be used to access and explore climate projections across Victoria. You can use the Tool to understand and plan for climate impacts at a regional and local level, and to inform risk assessments, research and planning for climate resilience for your sector and organisation.
The Tool was updated on 28 May 2025 to incorporate the latest climate projections data customised for the Victorian context (which informed VCSR24), including two new global emissions scenarios. It also features a more intuitive user experience.
VCSR24 builds on the earlier VCSR19, which remains a relevant component of our scientific evidence base. The Tool retains a dashboard for Victoria’s 2019 projections, so you can access the information you need.
The Victoria's Future Climate Tool User Guide provides detailed information for using the tool and the 2019 and 2024 dashboards in a range of applications.
The user guide for the 2019 dashboard remains applicable and was developed in collaboration with the Victorian Managed Insurance Authority (VMIA) to support the delivery of VMIA’s climate change risk management service. To learn more about the Tool and how it can be used, visit:
- Victoria’s Future Climate Tool – an introduction and guidance for risk management- accessible (DOCX, 8.8 MB)
- Victoria’s Future Climate Tool – an introduction and guidance for risk management (PDF, 1.1 MB)
Case study
This case study was developed in collaboration with Ambulance Victoria and VMIA to support the delivery of VMIA’s climate change risk management service.
Stress testing for the potential impact of heatwave on Ambulance Victoria (PDF, 3.7 MB)
Victoria's Future Climate Tool demonstration video
Download reports, regional summaries and supporting documents
You can learn more about Victoria’s changing climate through Victoria’s Climate Science Reports and a suite of products to support decision-makers with varying levels of climate literacy.
Under the Climate Change Act 2017 the Victorian Government prepares a report every 5 years, summarising the best available scientific evidence on climate change for our state.
Victoria's Climate Science Report 2024
Victoria’s Climate Science Report 2024 (VCSR24) is the latest report summarising the best available scientific evidence on the climate for our state.
- Victoria’s Climate Science Report 2024 (PDF, 15.8 MB)
- Victoria’s Climate Science Report 2024 - accessible (DOCX, 6.8 MB)
VCSR24 includes climate projections based on the latest generation of global climate models.
These models are from the sixth phase of the World Climate Research Programme’s Coupled Model Intercomparison Project (CMIP6).
Victoria's Climate Science Report 2019
VCSR24 builds on the first Victoria's Climate Science Report 2019 (VCSR19), which remains a relevant component of our scientific evidence base.
- Victoria's Climate Science Report 2019 (PDF, 6.7 MB)
- Victoria’s Climate Science Report 2019 - accessible (DOCX, 9.5 MB)
In keeping with the global-scale climate projections presented in the Fifth Assessment Report of the Intergovernmental Panel on Climate Change, VCSR19 used the fifth generation of global climate modelling. This modelling is from the internationally recognised World Climate Research Programme’s Coupled Model Intercomparison Project (CMIP5).
For more information on how VCSR24 and VCSR19 relate to each other refer to:
Victorian Climate Projections 2024 – Technical Report (PDF, 27.2 MB) features the latest global and climate modelling simulations for Victoria, that describe how Victoria’s climate is likely to respond to global warming.
Victorian Climate Projections 2024 – Addendum: future fire weather (PDF, 1.5 MB) this Addendum to the VCP24 Technical Report provides indicative changes of some aspects in future fire weather trends projected by NARCLiM2.0 modelling.
Updated Sea-Level Projections for Victoria 2024 (PDF, 3.2 MB) provides the latest science relating to sea level from the IPCC’s sixth assessment report and provides new sea level projections for Victoria.
Victorian Climate Projections 2019 – Technical Report (PDF, 36.0 MB) – aimed at scientists presents a comprehensive assessment of Victoria's changing climate using projections and data for medium (RCP4.5) and high (RCP8.5) scenarios of future greenhouse gas emissions. Also available at Victorian Climate Projections 2019
Several factsheets have been developed for Victoria’s new climate projections, providing further information on areas of user interest:
- Factsheet 1 - How do the Victorian Climate Projections 2024 compare with previous climate projections for Victoria? (PDF, 319.3 KB)
Factsheet 1 - How do the Victorian Climate Projections 2024 compare with previous climate projections for Victoria? - accessible (DOCX, 1.0 MB)
Outlines in more detail how Victoria’s updated projections compare with those produced for the inaugural 2019 report. - Factsheet 2 - What do the Victorian Climate Projections 2024 say about changes in rainfall? (PDF, 355.0 KB)
Factsheet 2 - What do the Victorian Climate Projections 2024 say about changes in rainfall? - accessible (DOCX, 1.1 MB)
Helps users of Victoria’s updated climate projections understand what they say about changes in rainfall and why they are more uncertain than other climate variables - Factsheet 3 - Using the Victorian Climate Projections 2024 (PDF, 295.6 KB)
Factsheet 3 - Using the Victorian Climate Projections 2024 - accessible (DOCX, 999.1 KB)
Documents some of the features of Victorian 2024 projections that can assist users - Factsheet 4 – Unmodelled futures and the Victorian Climate Projections 2024 (PDF, 382.2 KB)
Factsheet 4 – Unmodelled futures and the Victorian Climate Projections 2024 - accessible (DOCX, 1.2 MB)
Outlines other possible climate outcomes and changes not modelled by VCP24, including ‘tipping points’ and relevant extreme climate hazards.
10 Regional summaries have been developed detailing effects of climate change for each of Victoria’s regional partnership areas including Greater Melbourne.
Select your region to read a summary of what to expect of your local climate in the future based on the projections. Regional summaries are available for VCSR19 and VCSR24.
Regional summaries
2019
- Barwon 2019 (PDF, 1.8 MB)
- Central Highlands 2019 (PDF, 1.8 MB)
- Gippsland 2019 (PDF, 2.5 MB)
- Goulburn 2019 (PDF, 1.7 MB)
- Great South Coast 2019 (PDF, 3.1 MB)
- Greater Melbourne 2019 (PDF, 1.5 MB)
- Loddon Campaspe 2019 (PDF, 2.4 MB)
- Mallee 2019 (PDF, 1.5 MB)
- Ovens Murray 2019 (PDF, 1.9 MB)
- Wimmera Southern Mallee 2019 (PDF, 5.7 MB)
2024
- Barwon 2024 (PDF, 2.5 MB)
Barwon 2024 - accessible (DOCX, 507.3 KB) - Central Highlands 2024 (PDF, 2.4 MB)
Central Highlands 2024 - accessible (DOCX, 503.6 KB) - Gippsland 2024 (PDF, 1.4 MB)
Gippsland 2024 - accessible (DOCX, 505.3 KB) - Goulburn 2024 (PDF, 2.4 MB)
Goulburn 2024 - accessible (DOCX, 517.9 KB) - Great South Coast 2024 (PDF, 2.5 MB)
Great South Coast 2024 - accessible (DOCX, 499.7 KB) - Greater Melbourne 2024 (PDF, 2.5 MB)
Greater Melbourne 2024 - accessible (DOCX, 539.7 KB) - Loddon Campaspe 2024 (PDF, 1.3 MB)
Loddon Campaspe 2024 - accessible (DOCX, 513.2 KB) - Mallee 2024 (PDF, 2.4 MB)
Mallee 2024 - accessible (DOCX, 507.7 KB) - Ovens Murray 2024 (PDF, 1.3 MB)
Ovens Murray 2024 - accessible (DOCX, 524.8 KB) - Wimmera Southern Mallee 2024 (PDF, 2.4 MB)
Wimmera Southern Mallee 2024 - accessible (DOCX, 499.1 KB)
Minor updates to these regional summaries were made on 13 March 2025.
Our Frequently Asked Questions document provides answers to commonly asked questions about Victoria’s Climate Science Reports, supporting materials and Victoria’s Future Climate Tool.
To learn more about climate action in Victoria see:
- Victoria’s world leading emissions reduction targets
- Victoria’s systemic and evidence-based approach to adaptation.
Explore the climate drivers shaping Victoria's rainfall patterns through the Climate Dogs animations.
The Victorian Floodplain Management Strategy is helping prepare Victoria for a range of climate conditions by modelling different climate change scenarios as part of flood studies. Flood studies for urban and regional areas are informed by the most recent edition of the Australian Rainfall and Runoff Guidelines.
The Water and Catchments website shows how DEECA ensures Victoria has safe, sustainable and productive water resources to meet our urban, rural, recreational, environmental and cultural needs.
The Economic Impact of Heatwaves on Victoria. (PDF, 441.7 KB) shows the economic effects of heatwaves on Victoria, with regional and sector insights.
Visit DEECA’s Forest Fire Management Victoria to see how the state is addressing bushfire risks.
Review the latest sea-level rise projections for Victoria in the Updated Sea-Level Projections for Victoria 2024 report.
Contact us
If you would like to get in touch or find out more, email us at climate.change@deeca.vic.gov.au
Page last updated: 21/07/26