Progress towards net zero emissions by 2045
Victoria has cut emissions by almost a third since 2005

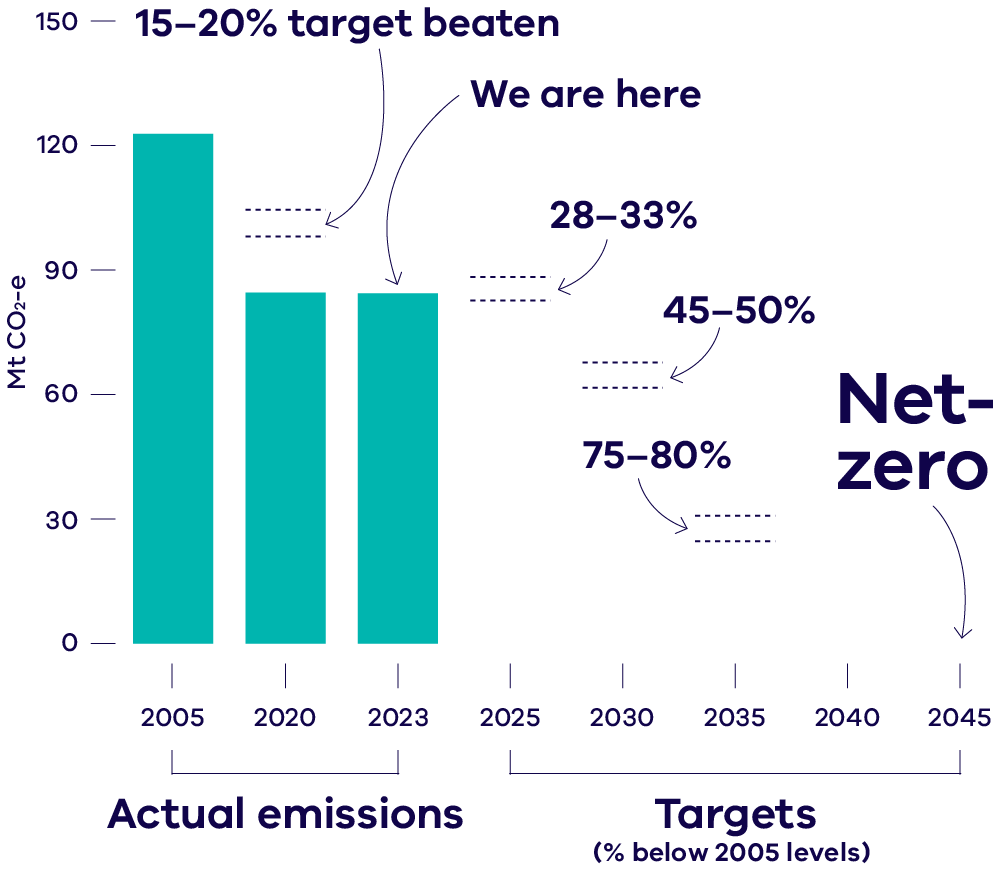
Victoria’s net greenhouse gas emissions for 2023 were 84.2 million tonnes of carbon dioxide equivalent (Mt CO2-e). This is a 31.4% reduction from 2005 levels. This is within the 2025 target range of reducing Victoria’s emissions by 28-33% below 2005 levels.

Find out more about Victoria’s emissions reduction targets.
Victorians emit fewer greenhouse gases than the national average
Victorians emit 12.3 tonnes (t) CO2-e per person on average. This is below the national average and the average of all states and territories other than Tasmania, South Australia and the Australian Capital Territory.

The sources of Victoria's emissions

Sector | 2023 emissions (Mt CO2-e) | Share | |
|---|---|---|---|
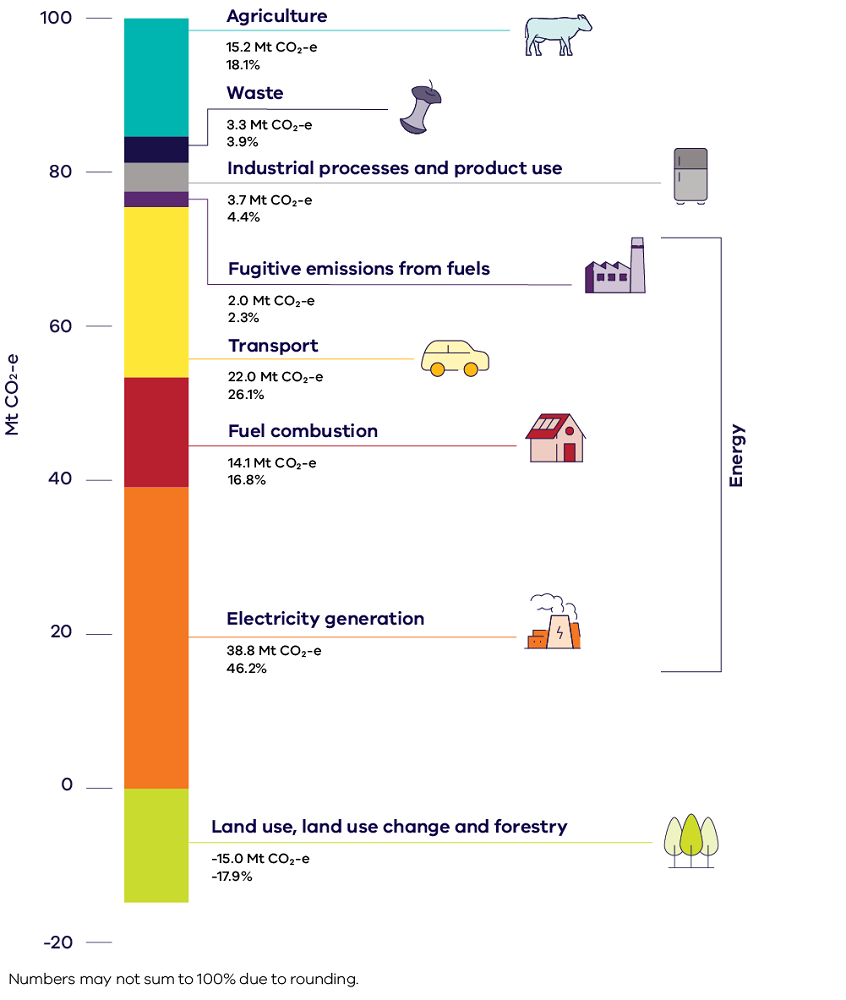
Agriculture | 15.2 | 18.1% | |
Waste | 3.3 | 3.9% | |
Industrial processes and product use (IPPU) | 3.7 | 4.4% | |
Energy: Fugitive emissions from fuels | 2.0 | 2.3% | |
Energy: Transport | 22.0 | 26.1% | |
Energy: Fuel combustion | 14.1 | 16.8% | |
Energy: Electricity generation | 38.8 | 46.2% | |
Land Use, Land Use Change and Forestry (LULUCF) | -15.0 | -17.9% | |
Total | 84.2 | 100% | |
Around 90% of Victoria’s net greenhouse gas emissions* come from burning fossil fuels to make energy. This energy is used for electricity, transport and fuel combustion.
Electricity is the top contributor to the state’s emissions – making up 46% of the state’s net emissions. The use of fossil fuels in transport contributes 26% of Victoria’s net emissions. Burning fossil fuels in homes, businesses and industry contributes 17%.
Aside from fossil fuels, other sources of Victoria’s emissions are:
- emissions from agriculture, at 18% of Victoria’s net emissions. This is mostly methane (CH4), which is burped out by cows and sheep.
- industrial process and product use emissions at 4% of the state’s net emissions. This is the release of human-made chemicals into the atmosphere.
- emissions from waste, which are also responsible for 4% of net emissions. This is mostly methane released from landfills and wastewater treatment plants.
The Land Use, Land Use Change and Forestry (LULUCF) sector reduced Victoria’s net emissions by 18% in 2023. This is because it accounts for trees and other plants, which absorb carbon dioxide (CO2) as they grow.
*Victoria’s net emissions are the sum of emissions from all sources minus absorption of carbon emissions from trees and plants in the LULUCF sector. This absorption of carbon emissions means that the sources of emissions add up to more than 100%.
Trends in Victoria's emissions
Victoria's shift to renewable energy continues to drive emissions down
Electricity generation emissions have fallen by 39% since 2005. This makes the sector the largest contributor to Victoria's emissions reduction.
This has been driven by the transition from coal-fired electricity to renewable sources. In 2023, renewable sources supplied 38% of Victoria's electricity generation. This represents a doubling of their share in the last five years.
Businesses and households have reduced their fossil fuel use
Emissions from burning fossil fuels in homes and businesses have decreased by 22% since 2005. This is due to a reduction in energy intensive manufacturing in Victoria and Victorian households using less fossil gas.
Recent declines in fossil fuel use by households have seen their emissions in 2023 return to around 2005 levels.
Transport emissions increased as post-pandemic recovery continued, despite growing electric vehicle sales
Transport emissions have steadily risen over the past few years, though in 2023 were still 3% lower than pre-pandemic levels. While electric vehicle (EV) sales are growing, they still represent a very small proportion of the overall vehicle fleet.
The increasing popularity of larger vehicles including SUVs and utes has reduced the impact of EVs.
Victoria’s forests are absorbing more carbon
Since 2012, the land sector has absorbed more carbon dioxide than it emits. This makes it an important carbon sink. This is largely due to a reduction in land clearing and native forest harvesting, as well as growth in plantation forests.
Victoria’s population and economy are growing, while emissions are falling
The emissions intensity of Victoria’s economy measures the amount of emissions that are produced for every dollar the state's economy generates. Since 1990, this has dropped by 69%.
This means that Victoria’s population and economy have continued to grow, while emissions have decreased.

Greenhouse gas emissions resources
The Victorian Government publishes a report every year on Victoria’s greenhouse gas emissions. The report uses data prepared by the Commonwealth Department of Climate Change, Energy, Environment and Water (DCCEEW), in line with internationally agreed rules: Emissions reporting - DCCEEW.
To learn more about Victoria’s emissions and how we are tracking towards net zero emissions by 2045, use the following resources.
Downloads
- Victorian Greenhouse Gas Emissions Report 2023 (PDF, 2.2 MB)
- Victorian Greenhouse Gas Emissions Report 2023 - accessible (DOCX, 610.0 KB)
- Victorian Greenhouse Gas Emissions Report 2023 - chart data (Excel, 217.2 KB)
Previous editions of the Greenhouse Gas Emissions Report
- Victorian Greenhouse Gas Emissions Report 2022 (PDF, 1.8 MB)
- Victorian Greenhouse Gas Emissions Report 2022 - accessible (DOCX, 511.5 KB)
- Victorian Greenhouse Gas Emissions Report 2022 - chart data (Excel, 466.3 KB)
- Victorian Greenhouse Gas Emissions Report 2021 (PDF, 5.5 MB)
- Victorian Greenhouse Gas Emissions Report 2021 - accessible (DOCX, 7.9 MB)
- Victorian Greenhouse Gas Emissions Report 2020 (PDF, 2.7 MB)
- Victorian Greenhouse Gas Emissions Report 2019 (PDF, 3.8 MB)
- Victorian Greenhouse Gas Emissions 2018 (PDF, 1.5 MB)
- Victorian Greenhouse Gas Emissions 2017 (PDF, 1.8 MB)
- Victorian Greenhouse Gas Emissions 2016 (PDF, 2.4 MB)
Updates to the way emissions are calculated
DCCEEW makes improvements to emissions methods in response to new data, improved science and review by international experts.
The new methods are required to be used to recalculate old emissions data. These changes apply to all years from 1990 onwards. This means that method improvements can change Victoria’s emissions in 2005, which is the baseline year for Victoria’s interim emissions reduction targets.
Further details are available in the Victorian Greenhouse Gas Emissions Report 2023.
Contact us
Contact us via email climate.change@deeca.vic.gov.au
Notes
To simplify comparisons across various greenhouse gases, they are expressed in terms of carbon dioxide equivalent (CO2-e), which indicates the amount of carbon dioxide that would cause the same amount of global warming over a 100-year period.
This data covers financial years, with 2023 referring to the period from 1 July 2022 to 30 June 2023.
Page last updated: 13/11/25